What’s new and how do you apply it in practice?
Why MLflow?
Machine learning projects are growing in complexity. Often multiple data scientists and data engineers work together on the models in one team. It is obviously important that the models are reproducible, scalable and manageable throughout the process. Multiple models, datasets, notebooks, scripts, without structure you logically quickly lose the overview. MLOps has become indispensable , it standardizes, automates and makes work scalable. MLflow is the tool to keep a grip on your ML workflow.
With MLflow you track experiments, register models and automatically get performance insights (such as statistics like accuracy, precision and recal) directly in your interface. No extra code, but more control.
Version 3.0 of MLflow was recently released with several new features that address the latest trends, such as GenAI and LLMs and the need for larger, faster and reproducible data science models.
What’s new in MLflow 3.0?
MLflow 3.0 introduces a number of important innovations that allow you to work faster, more clearly and more broadly.
Introducing the LoggedModel architecture.
The biggest development in deep learning is improved model tracking. Although in MLflow 2.0 it was already technically possible to log multiple model checkpoints, this was not standardized and often lacked the direct linkage between a logged model and the context in which it had been trained and evaluated. The updated model tracking provides extensive traceability between different models, runs and evaluation metrics via the LoggedModel architecture. With this architecture, different model checkpoints and metadata can be logged within a single run and their performance can be tracked on different datasets. This is especially useful in deep learning workflows, where you want to store and compare models at different training times. You can log multiple checkpoints within a training and find them directly with performance data on different datasets. By using the step parameter in the log functions, you can log checkpoints at specific training times. Each logged model is given a unique model ID with which it can be easily referenced later. Ultimately, you can select the best performing model from the various checkpoints based on performance metrics.
In short: you no longer have to structure it manually. MLflow does it for you. Each logged model variant gets a unique ID, linked to its context, training step and evaluation results. You can easily retrieve which model was logged at what time and how the model performed.
Support for LLMs and GenAI
MLflow now offers:
- Prompt logging and output tracking;
- You can log prompts and generated outputs, which makes it easier to reproduce and compare experiments with LLMs.
- Evaluation via the GenAI Evaluation Suite;
- With the GenAI evaluation suite, you can maintain GenAI applications just as you do with traditional machine learning models. Not only to measure the quality of the applications, but to improve and maintain them throughout the cycle.
- A prompt registry.
For reusable and better prompts, MLflow 3.0 provides a prompt registry. You can automatically improve your prompts based on evaluation feedback and labeled datasets. A separate blog on how to effectively deploy LLM evaluation with MLflow 3.0 will appear soon.
Use Case: Image classification with MobileNetV2
Data and Preprocessing
We use the Intel Image Classification
With landscape photos from Kaggle, categorized into different classes. After splitting into train, validation and test sets, we perform data argumentation with Keras.
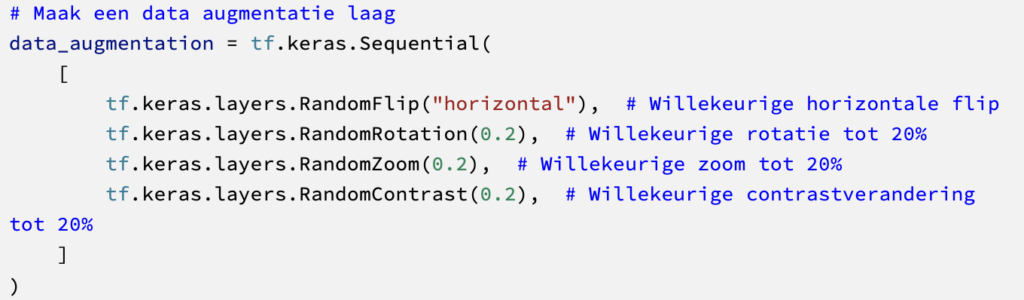
Below are examples of what the images look like after augmentation is performed.

This is followed by pre-processing using the same pipeline as MobileNetV2.
Model MobileNetV2 and MLflow integration
We choose MobileNetV2 because of balance in performance and speed. The model is lightweight, pre-trained and we freeze the base layers because we don’t want to re-train all the weights.

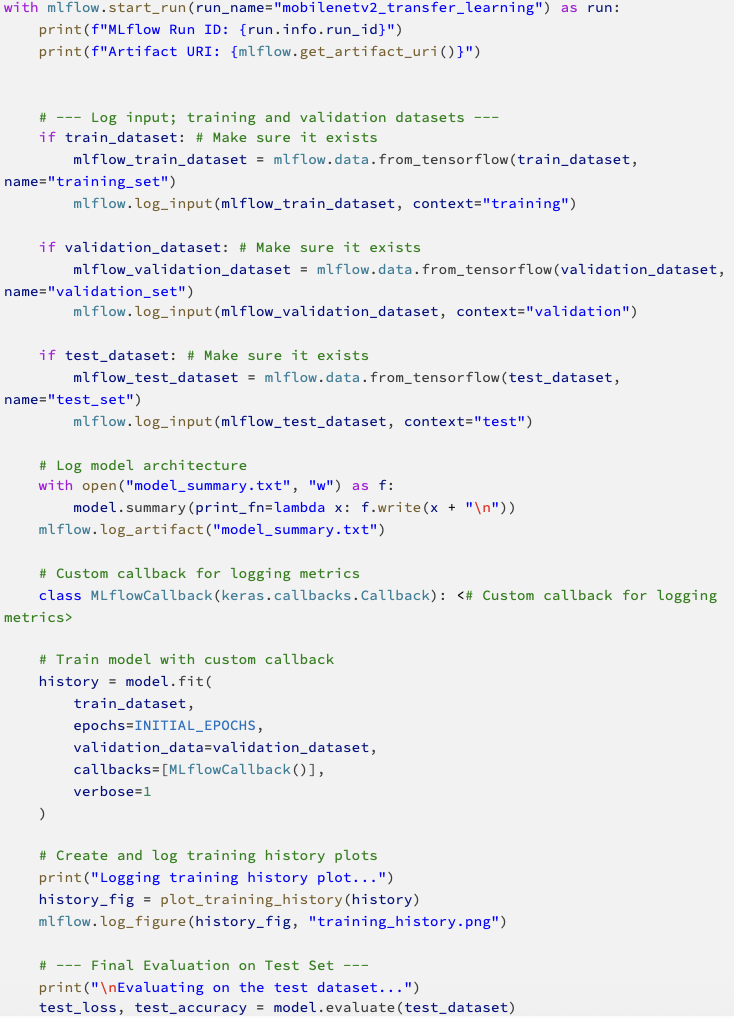
Instead of autolog, we use deliberate, manual logging. This gives more control over what gets logged and what doesn’t, and so you keep better control over your model and what you store about it. This is essential for scalable evaluation. We log checkpoints per epoch, different metrics per datasets and parameters per model variant. This is done with a custom MLflow callback, which automatically logs everything after each epoch.
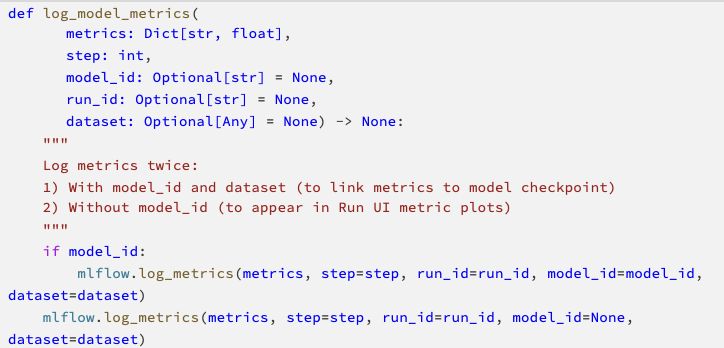
This function is used in a custom callback class that logs the information during training after each epoch for the model and the corresponding training run.

Model training and run management
Now that the model is compiled, we are ready to train the model. Since we also want to use MLflow to track the training to provide insight into the performance of the model, we first need to initiate a tracking experiment. Here you specify where to find all training runs and can give the run an experiment name.
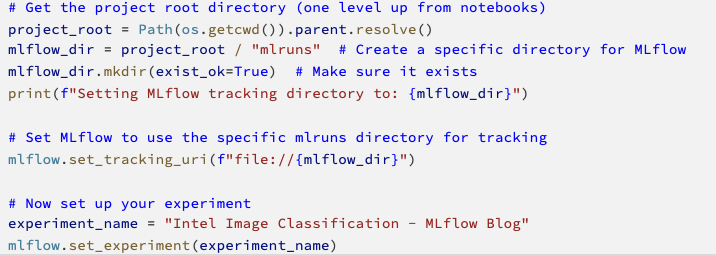
The model is ready for training and is run per run with MLflow. This allows several runs to be run within an experiment. These can later be compared with each other. A run as we have run it looks like this:
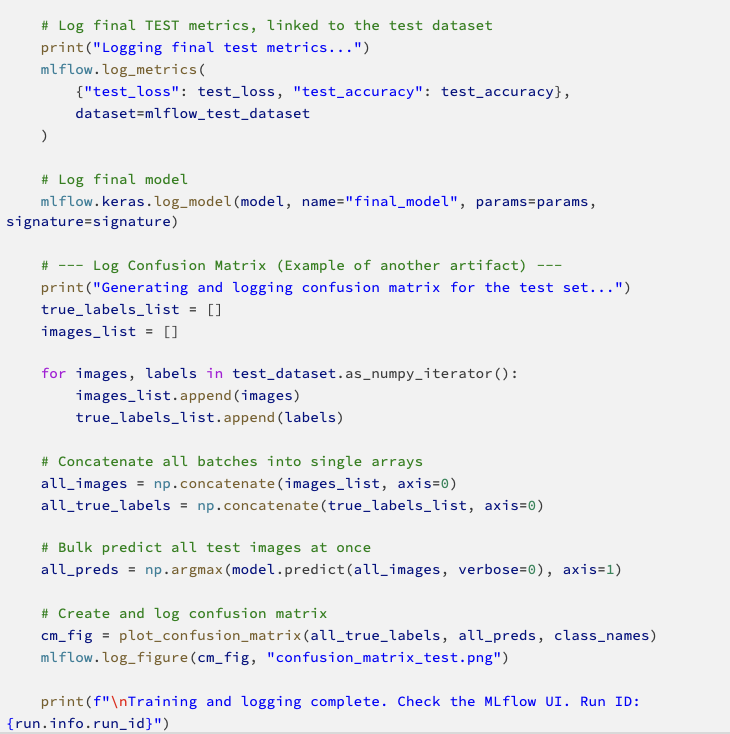
After running the model, we can use MLflow 3.0’s new functionality to retrieve the logged models and their results using the code below:

With MLflow 3.0, you can easily filter by performance to select the best model. A nice addition is the possibility of filtering. You can include conditions when searching for the best and most suitable model. Think of search terms like “accuracy > 0.9”. Based on these conditions, you can select the best performing model to save and deploy.
MLflow UI
For this case, we looked at which model performs best based on the epoch. When we go to the Run page of the MLflow UI, we can see the run and the logged models with the appropriate names.
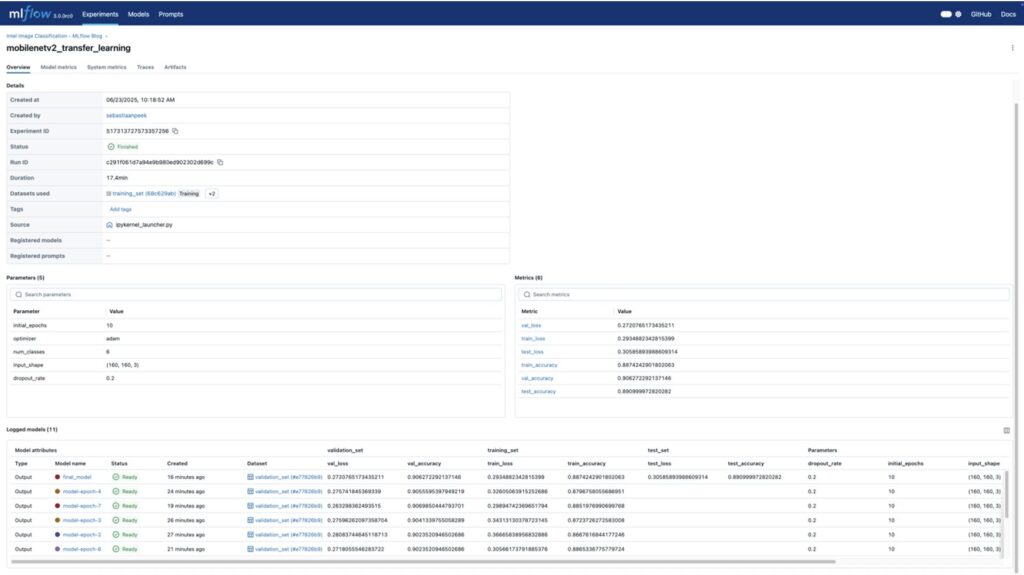
The Models tab shows all stored models with their associated metrics.

The artifacts tab are all the additional files, results and figures that can be stored per model. Such as information about the environment in which the model was run, or the design of the model.

In addition, MLflow also provides the freedom to manually add files/artifacts within the run. These can be found in the Run’s Artifacts tab, and can be useful for logging any additional information, such as a confusion matrix, for example.

Next steps
With this use case, we show how you can use MLflow 3.0 to lay a foundation for a structured and reproducible machine learning workflow. But of course much more is possible within MLOps to further improve your platform.
Want to further integrate MLflow into your organization? Then consider:
- CI/CD integration for automatic retraining & deployment;
- Stage transitions to use within model registry (“Staging”, “Production”) to better manage your model lifecycle;
- Set alerts for model drift via monitoring tools.
What you need depends on where you are in your MLOps process. This includes the maturity of your data science process, the scale at which you work and the complexity of your models.
Key takeaways
- LLMs & GenAI: Multiple new features focused on LLMs, including prompt logging and evaluation via the GenAI evaluation suite.
- Conscious evaluation: Explicit logging instead of autolog allows for more conscious evaluation of models.
- Thanks to the comprehensive LoggedModel architecture, the model is central to the entire MLflow lifecycle. This provides control not only over experiments, but also over managing, versioning and deploying models towards production, allowing you to make the entire development workflow flexible and scalable.
- UI: A central environment where all results around models and runs are clearly displayed in a UI, making model comparison quick and easy.
- Selection: Easily filter the best performing model per use case.
Also getting started with MLOps and deep learning in your organization?
At DSL, we like to think with you. Schedule an introductory meeting.