
Safer railways with Fiber-Optic Acoustic Sensing
ProRail

We build models that detect anomalies in measurement and sensor data. For ProRail, we apply machine learning to fibre-optic measurements from railway tracks.
In ProRail’s data lab, we explored what fibre-optic cables that measure sound waves could do to help make the rail network safer and more sustainable. Built on Databricks and Azure.
Sensors, meters and log files generate data every second. Usually, no one looks at it until an alarm goes off. A model can spot a change in a pattern earlier, and show where it is happening.
Just as we set out to detect trains and wheel defects in sound waves for ProRail, a model can identify events in your own measurement series.
A model that learns normal behaviour flags what is different, even when faults are rare and have never been labelled.
Sensor data linked to work orders and fault reports, so the model learns what happened after an anomaly.
Monitoring and retraining after deployment keep the model working as sensors, equipment or conditions change.
Which measurements are available, how often they’re taken, how clean the data is, and which event you want to detect.
Look for patterns with your technicians and test an initial model on a past period.
The model in production, with alerts routed to the people who act on them and regular monitoring of its performance.
You already collect measurement data from equipment, vehicles or networks, you want to spot problems earlier, and someone is available to act on an alert.
You barely collect any measurements yet, or a fixed threshold already catches every problem. In that case, start by measuring or setting up a simple alarm.
The number of sensors and data sources, how often they take measurements, whether you have a history of faults, and whether the model needs to run live or analyse data afterwards.
Then we adjust the threshold with your technicians. An alert that repeatedly proves unfounded gets ignored, so we track that from the start.
Choose this if problems always occur above or below a particular value. It’s simple, but misses patterns that develop gradually.
Choose this if you want to understand what happened during previous failures. You’ll learn a lot, but you won’t spot the problem any earlier next time.
Choose this if you want to spot anomalies before an alarm goes off. Our advice: start with one installation that has a history of failures.
Data Science Lab operates from Westerdoksdijk in Amsterdam, also serving Almere and Flevoland. We’ve worked with measurement data for ProRail, Rijkswaterstaat and Port of Amsterdam. We’re a Microsoft Partner and a Databricks Partner.
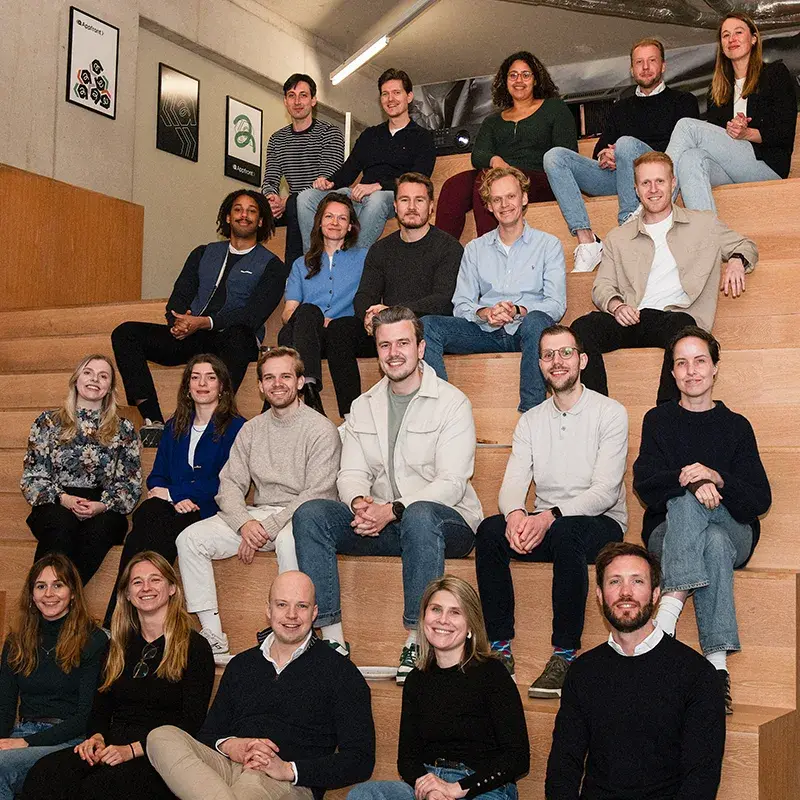
Stef is your point of contact. In our first conversation, we’ll discuss what data you measure and what you’d like to see sooner.
E-mail info@datasciencelab.nl
Phone +31 (0)20 3636 724
Tell us what measurements you have and what currently happens to the data. We’ll reply by email or arrange an initial conversation.
Message sent
Thanks for your message. We’ll be in touch as soon as possible.
It builds models that use your data to recognise, predict or weigh up options, and puts them into production. We focus on measurement and sensor data from installations, vehicles and networks.
You can read about more applications under AI applications.
Vibration, temperature, pressure, electrical current, sound, flow rate or position data from sensors, meters or systems that write log files. For ProRail, we worked with fibre-optic cables that measure sound waves.
Accurate timestamps are important.
A model learns what normal behaviour looks like and flags deviations. This also works when faults are rare and there are few examples of them.
You can read how we build these models under machine learning.
Usually, if you have large volumes of measurement data: the data needs somewhere to be brought together and processed. For ProRail, we worked on Databricks and Azure.
If nothing is in place yet, we build the foundation first.
Data Science Lab is based in Amsterdam, close to Almere. We visit for the initial work and to work with your technicians; we do the rest remotely.
That way, we work alongside the people who know the installations.
By continuing to measure its performance after it goes live and retraining it when sensors or installations change. We can manage that for you.
Read more under MLOps.
Our AI consultant for Almere is a better fit. We help you decide which question to tackle first, whether it concerns your fleet, workshop or warehouse.
Then we build the model.
Yes. Recognising things in images is a distinct discipline, with its own requirements for cameras and lighting. Read about developing a computer vision solution.
We often combine images with other measurements.