
Insight into actual passenger numbers using computer vision
GVB

We replace manual counting and sampling with a model that measures continuously and forecasts ahead, as we did for GVB’s passenger counts.
GVB counted passengers on its vehicles by hand. This took a lot of work, was prone to errors and provided only a snapshot. Our software counts passengers in security camera footage; only the model analyses the footage. GVB operates in Amsterdam, not Amersfoort: this case study shows how we automate passenger counting.
In Amersfoort, health and social care is the largest sector, while ICT and financial services also have a relatively strong presence. Our picture of workloads, waiting lists or requests sometimes still comes from a tally sheet. A model can calculate continuously using data that is already being recorded.
For GVB, we developed software that counts passengers in camera footage, so GVB can track numbers over a longer period rather than at a single point in time.
With Port of Amsterdam, we developed a tool that measures and shows how berths have been used over time, providing a basis for policy decisions.
Once measurement is in place, a model predicts crowd levels or arrivals for the coming period, giving a range rather than a single number.
When counting people, we process only the data needed for the count and design the processing with your privacy officer.
Which count or estimate informs a decision, and what records or images are already available for it?
For a period, the model counts alongside your own tally so you can see where the differences lie.
Once the measurement is accurate, it runs continuously and we forecast ahead, monitoring for anomalous input.
A decision about capacity, staffing or space depends on a count or sample, and camera footage, log files or records already exist that could be used to determine the number.
The count is rarely needed, your own system already provides the number, or nobody makes a decision based on the result. In those cases, a report from that system is enough.
Which sources we use, whether images or text need processing, how often the measurement is updated, whether a prediction is added and who manages the model.
That is for your privacy officer or lawyer to decide. We provide what they need: which data is used, for what purpose and what the model stores. At GVB, only the model analyses the camera footage.
Choose this if the number varies little and you only need to know it occasionally. A consistent approach and a report will then give you enough certainty.
Choose this if the number varies by day or location and you want to see where and when it changes. Our advice: start here, because every forecast needs that series of measurements.
Choose this if you need to plan staffing, space or equipment in advance. The model projects forward based on the measurements and shows how certain the forecast is.
Data Science Lab has worked with data and AI since 2016. We’re a Databricks and Microsoft partner based on Westerdoksdijk in Amsterdam. In Amersfoort and Eemland, we can visit you or work online. We share our knowledge at our Techdays.
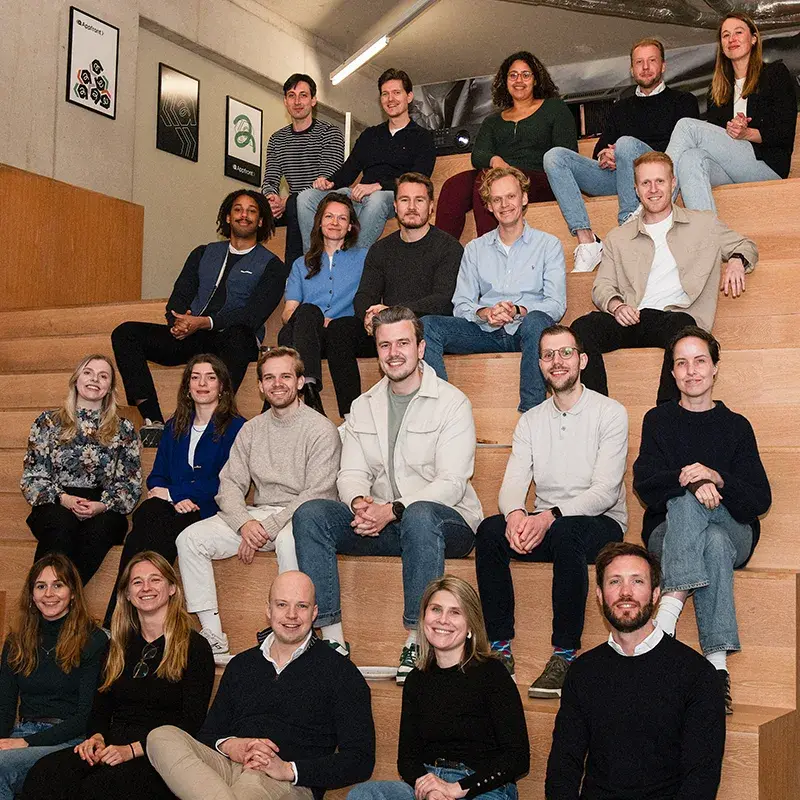
Stef is your first point of contact. In our first conversation, we look at which count informs a decision and what data is already available for it.
E-mail info@datasciencelab.nl
Phone +31 (0)20 3636 724
Tell us what you currently count or estimate and what data you already have. We’ll reply by email or arrange an initial conversation.
Message sent
Thanks for your message. We’ll be in touch as soon as possible.
It builds a model that uses your own data to measure, predict or classify something, tests it and puts it into use. According to UWV, health and social care is the largest sector in Amersfoort, while ICT and financial services play a relatively large role.
If you’re looking for data science support in Amersfoort or the surrounding area, we can provide the team. You can find all our applications under AI applications.
We don’t have an office there: we’re based on Westerdoksdijk in Amsterdam. We don’t have a published case study from Amersfoort either. GVB and Port of Amsterdam are based in Amsterdam; their case studies show how we measure and count.
If you work elsewhere in the province, read about our data science consultancy in Utrecht.
For a period, we run the model alongside your own counting process and compare the results by location and time. Where they differ, we look for the cause: a camera angle, poor lighting, people being counted twice or a record that is sometimes missing.
We only rely on the series to make a decision once we’ve explained those differences.
Yes, and that’s often the next step. A daily or hourly series reveals seasonal trends, weekly patterns and the effects of holidays. A model learns from these and forecasts the coming period, with a range of possible values.
You can read how we build and explain such models under machine learning.
The data often already exists: camera footage, logs from access gates or systems, appointments in a calendar or requests in a case management system. Sometimes a new source needs to be added.
For Port of Amsterdam, we developed a tool that measures and shows how berths have been used over time.
Yes, but that’s a different question from measuring and predicting. It involves applications that become part of day-to-day work and need managing after go-live.
For more on this, read about our AI consultancy in Utrecht: building AI and taking it into management.
When the number is already in a system, the count is rarely needed or no decision depends on it. A model also needs maintaining, which takes time and attention.
Sometimes a better sampling approach or a report from your own system is enough. If so, we’ll say so.